Understanding your data is easy but first you need to log into the Little Forest platform using your email and password.
Log In Here
Then their are a couple of different ways to see how your errors have changed:
Option 1:
If you click on the score:
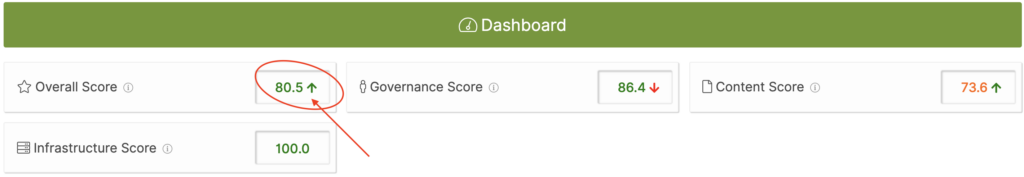
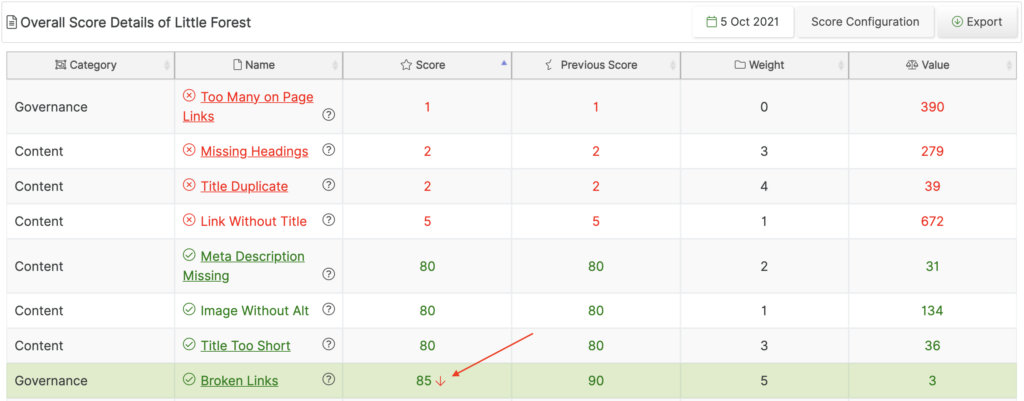
You can see what has changed from week to week.
E.g. here you can see a red down arrow showing that the score went down for the ‘Broken Links’ this week. Which means we found more errors than the previous scan:
Option 2:
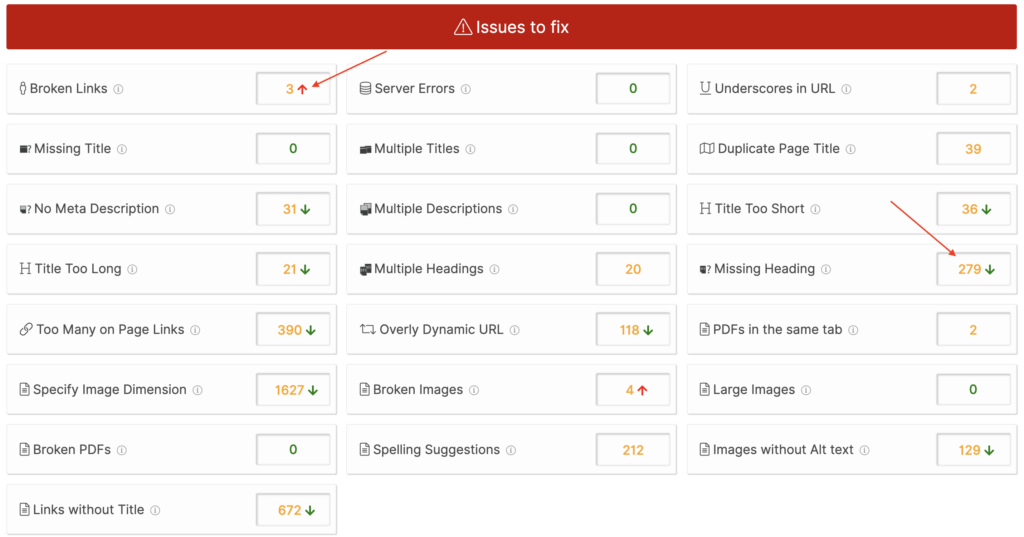
The ‘Issues to Fix’ shows red and green arrows showing if there are more or less errors compared to the last scan:
HOT TIP – The colour and direction of the arrow show if it is a positive or negative change. No arrow means no change.
Option 3:
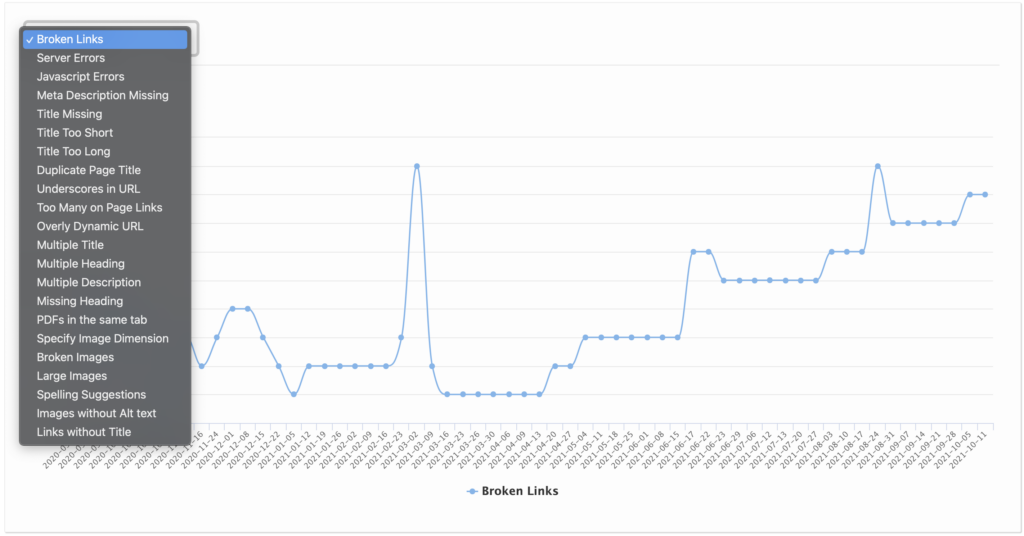
You can also look at the graphs for the ‘Issues to Fix’ to see the history or every error type:
For additional help understanding your errors and progress, please email; [email protected]